
Every organization these days want to rank on the top position of the search engine pages or at least be present on the first page of the search engine. They hire various SEO companies in town to perform the SEO tasks and grab the position. Various elements are necessary and should be considered in order to grab better rankings.
One of the important factors is your ‘Content’. The content plays an important part when it comes to higher rankings. Every content, from blogs to infographics is vital. Only having a written content is not enough, you need to be a lot more creative to engage more people. The more interesting and attractive your content is the more amount of traffic on your website.
Some organizations focus more on creating infographics because infographics are easy to read, understand and less time-consuming. In a lesser amount of content and time, you are educating people with a lot of information. This does not mean that any infographic can do well. While creating an infographic, you need to be creative.
There are tons of software available online for creating infographics but, can you tell which one is the best? Well, we can! We have a list of free and handy tools which you can use to create different types of infographics.
Let us have a look at the list
Visme
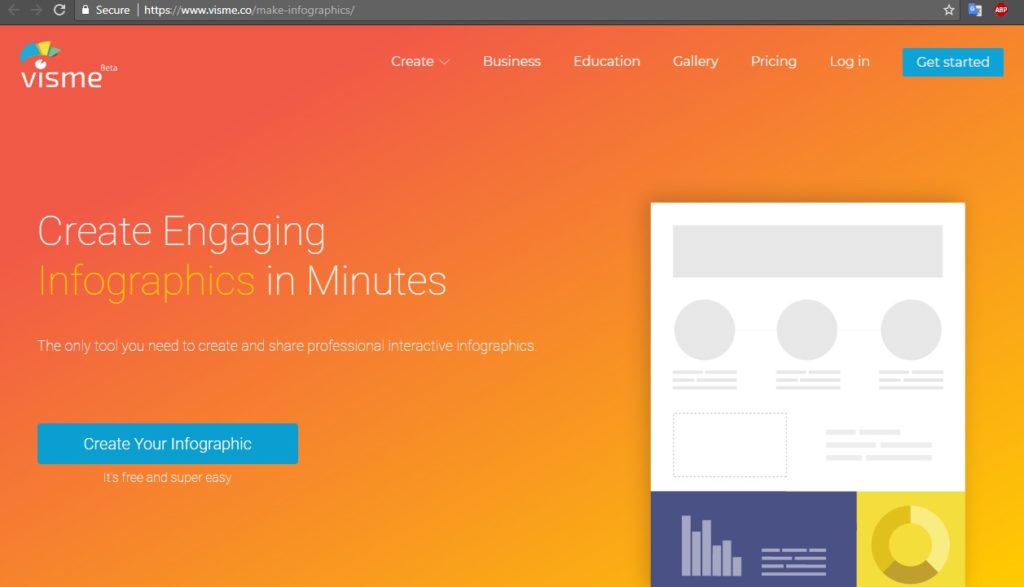
Visme tops the list because it is an infographic builder which includes a huge range of assets. This tool provides millions of free images, hundreds of fonts, and thousands of quality icons. Also, there are options to include video and audio (including the ability to record a voiceover directly in the editor). This tool is specially crafted for creating infographics but you can also use it for building presentations. To make things clearer, you can also animate your content.
Canva Infographic Maker
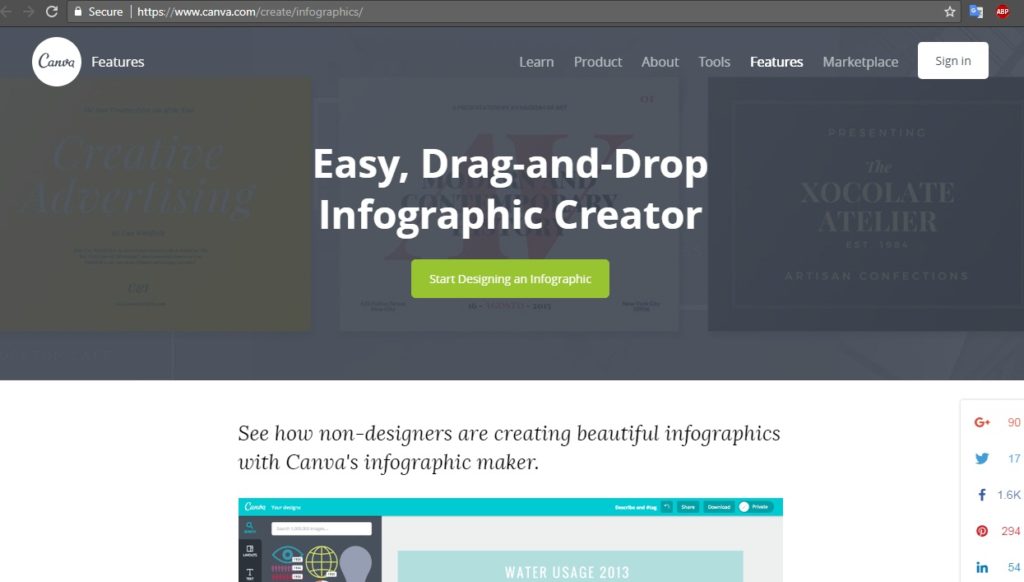
Canva Infographic Maker is an easy-to-use and powerful online tool that can be used for every type of design tasks from brochures to presentations and much more. This tool also provides the user with a vast library of images, icons, fonts, and features to choose from. It is a dedicated infographic maker that you can use for free which comes with hundreds of free design elements and fonts at your fingertips. There are also many more premium elements that you can buy for up to $1 (Rs.64). You can download the Canva iPad application to design on the move or use it in the browser.
Google Charts
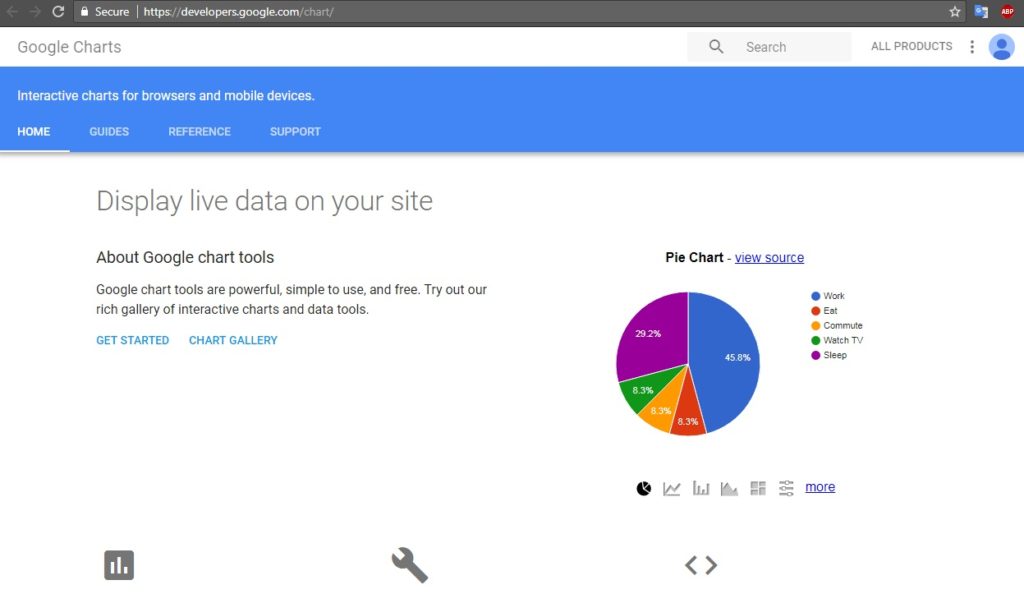
All the tools provided by Google are amazing and so is the Google Charts. This is a free, simple to use, and powerful tool. A huge variety of charts are available from which you can choose and configure an extensive set of options to perfectly match the look and feel of your website. Google charts connect your data in real-time which makes it a perfect infographic generator for your website.
Piktochart
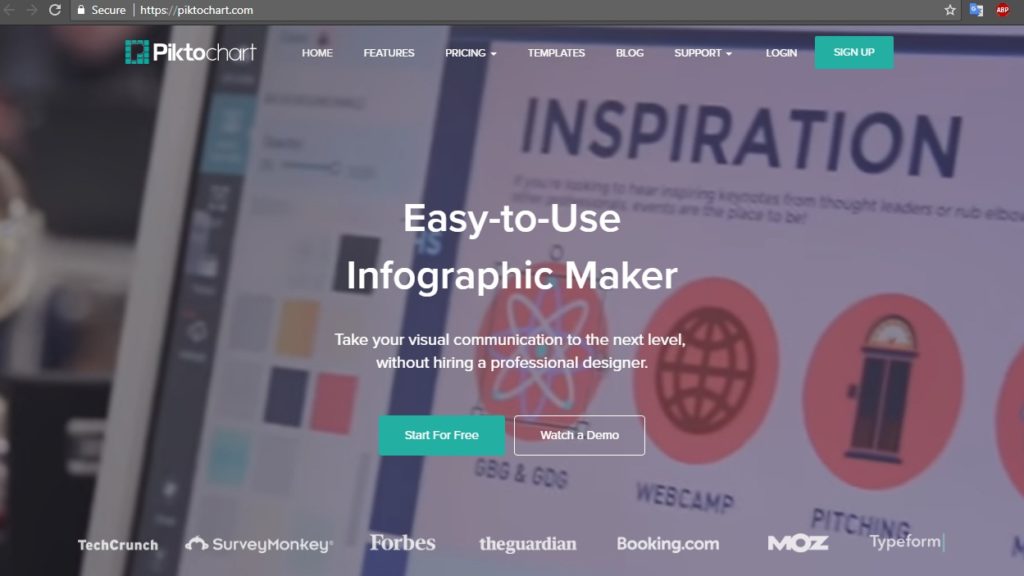
Piktochart is an Infographic and presentation application that makes it easy to turn the boring content into an engaging one with just a few clicks. The custom editor of the tool allows you to do things like modifying colour schemes and fonts, insert preloaded graphics and upload basic shapes and images. The grid-line templates allows you to align graphical elements and resize images proportionally. The free version of the application offers three basic themes, a Lite pricing plan for $15 (Rs.957) per month. And a Pro version costs you, $29 (Rs.1849) per month.
Infogram
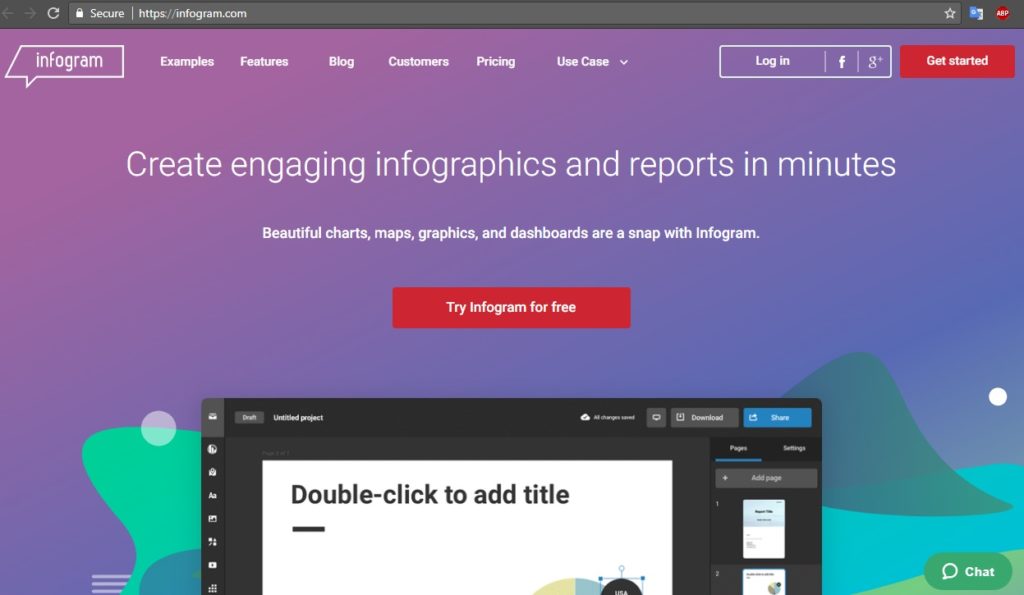
Infogram is free infographic tool which provides a wide variety of graphs, charts, and maps as well as the ability to upload pictures and videos. The uniqueness of the application is that you enter and edit the data that makes up the infographic in an Excel-style, the contents of which are reflected in your design. This is a smart software that automatically changes the look of the infographic to perfectly represent your data. When you are done with the infographic creation, you can publish it to Infogram website for others to enjoy or share it on social media.
Venngage
Venngage is an amazing, simple, and easy-to-use tool for creating and publishing infographics. There is a huge variety of templates, themes, and hundreds of charts and icons you can choose from. Also, you can upload your own images and backgrounds, or adapt a theme to suit your brand.
Vizualize
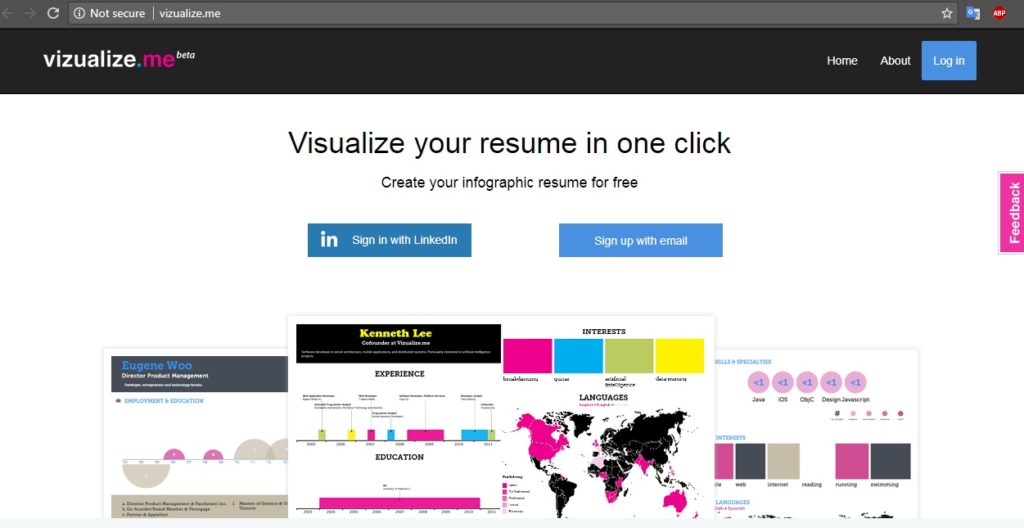
Vizualize can turn your basic resume into a visual treat. You can visualize your resume with just one click and also you can take a look at previous examples. The core idea behind this application is to enable people to express their professional accomplishments in a simple yet compelling personal visualization. We know that the infographic resumes are not suitable for every situation but, they can be a great option for certain cases.
Easel.ly
Easely.ly is a free web-based infographic builder tool which offers you a range of templates to start you off, all of which are easily customisable. A lot of things are accessible from the library like arrows, shapes and connector lines. You can also customise the text with different fonts, colours, text styles, and sizes. The tool lets you upload and position your own graphic with one touch. The free version of the tools provides 60 images and 10 fonts. In the paid version, that is, $3(Rs.192) a month you get a much wider pool of resources plus boosted security options.
This is our list of best Infographic creation tools. If you know any such tools, do let us know in the comment section below.
